
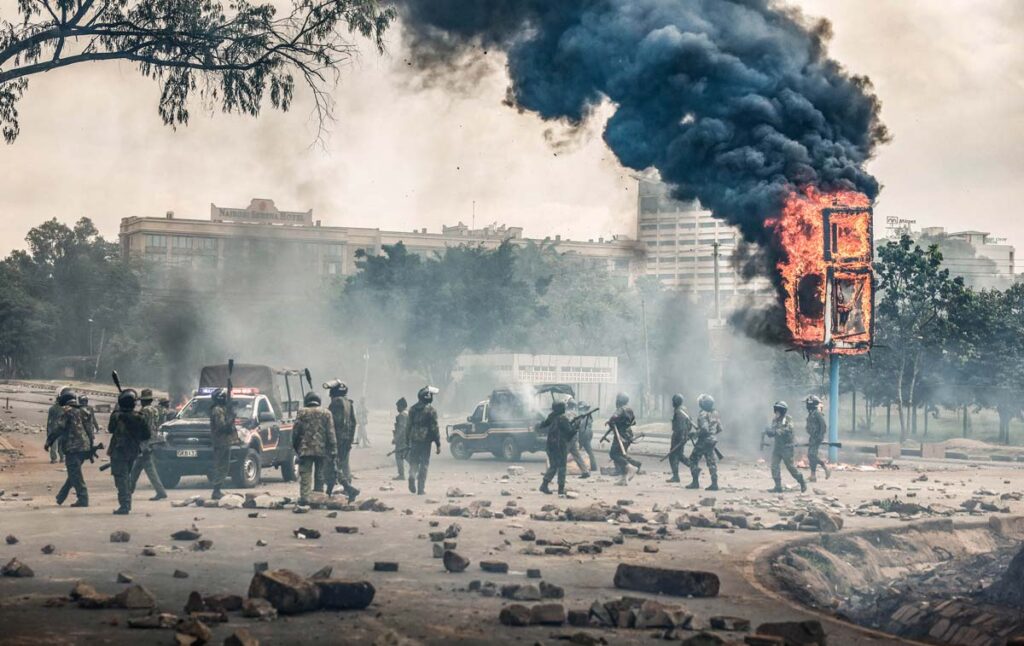
“When elephants fight, it is the grass that gets trampled” is a common yet profound African proverb highlighting the widespread consequences of violence. Violence affects everything from people’s psyche to economic growth and democratisation. This has led scholars from various disciplines to explore how exactly violence affects people, not just from a mental health perspective, but also how it informs and shapes their worldview. Political scientists, for instance, have sought to understand how various forms of political violence impact perceptions around democratic processes and institutions. Scholars such as Inken von Borzyskowski and Ursula Daxecker have found that fear of election violence increases support for autocracy across Africa.
Similarly, Jacob Lewis found that increased exposure to riots in South Africa correlates with decreased satisfaction with democracy. The current political context across Africa, from an increasing number of military coups to a decline in satisfaction towards the current state of democracy, means perhaps it’s time to consider more seriously how violence contributes towards these challenges. As such, throughout the article, I hope to explore how political violence affects Africans’ perceptions of democracy. To do this, I will be using statistical methods, namely regression analysis, to explore the effect that political violence has on democracy.
The end of the Cold War signalled a significant shift in global geopolitics. Specifically, the rise of liberal democracy and globalisation saw many countries begin to make the shift towards democracy, especially those that were in conflict for many years. As such, the implication in both scholarship and policy became that democracy was the antithesis to war and violence. However, since then, there has been much debate from scholars, particularly in the Global South, who have argued that violence and democracy can co-exist. This has reshaped how violence and democracy are understood. More specifically, it meant scholars no longer view violence as just an outcome but also as a driver of how society is shaped in the 21st century.
Building on this work and others in the field of political psychology, I argue that political violence is a key driver in how Africans view democracy and engage in political participation. I specifically hypothesise that support for democracy and political participation is negatively affected by political violence. This means that the higher the levels of political violence, the less people will see democracy favourably and are less likely to participate in civic duties.
To conduct the analysis, I used data from a number of sources, including Afrobarometer’s Round 9 survey covering 39 African countries. This public-attitude survey created a representative cross-section sample of adult Africans, covering topics of democracy, governance and the economy. Unlike with other studies, which focus on African states that have strong democracies, I focused on all countries surveyed in the Afrobarometer Round 9 attitudes survey. This is because my focus is not necessarily exclusive to countries that have a democracy; instead, it focuses on the perception of such issues and, therefore, does not require me to focus on countries that are democratic.
I also used data from the World Bank, including the World Governance Indicators and World Development Indicators, which are both datasets with a wide array of data, from national GDP data to development indices. The study used the WGI’s Absence of Political Violence/Political Stability measure, to measure political violence. This indicator is a country-level measure that captures the perceived absence of political violence and overall stability of a country.
This measure is used instead of something more specific because other measures largely capture specific political violent events and not necessarily the sense of fear or safety that one feels due to such violence. Using a more comprehensive figure that considers a wider range of characteristics allows for more accurate results.
The measure itself ranges from -2.5 to +2.5. For this analysis, instead of using the original direction of the scores (higher = lower level of political violence), I reversed the order so that the higher the score, the greater the level of perceived political violence. This makes the results more intuitive. Since I am focusing on political violence, not its absence, revising the direction of the scores allows for an easier interpretation of the results.
Regarding the dependent variables, I consider two key outcomes, both taken from the Afrobarometer survey. The first relevant dependent variable measures respondents’ support for democracy. I measure this based on the responses from Question 23 of the survey, which asks respondents: Which of these three statements is closest to your own opinion?
- Statement 1: Democracy is preferable to any other kind of government.
- Statement 2: In some circumstances, a non-democratic government can be preferable.
- Statement 3: For someone like me, it doesn’t matter what kind of government we have.
Respondents could choose from one of the following options: Statement 1, Statement 2, Statement 3, Refuse to Answer or Don’t Know.
Since I am primarily interested in Statement 1, I collapsed the three responses into a dichotomous variable (meaning there are only two options) to reflect whether someone prefers democracy or not. As I am not as interested in the other statements, it makes sense for me to dichotomise the variable in this way.
Secondly, to measure the respondents’ participation in various civic activities, I used responses from Questions 10a to 10c. Each question follows a similar logic: Here is a list of actions that people sometimes take as citizens. For each of these, please tell me whether you have done any of these things during the past year:
- Question 10a: Attended a community meeting.
- Question 10b: Got together with others to raise an issue.
- Question 10c: Participated in a demonstration or protest march.
For each question, respondents could choose from the following options: No: I would never do this, No: But I would if I had the chance, Yes: Once or twice, Yes: Several times, Yes: Often, Refuse to Answer, or Don’t know.
To measure the extent of respondents’ political participation, I developed a political participation index using each respondent’s responses to the three questions above. To best capture the different options respondents were given, I scaled the index from 0 to 4, with a score of 0 reflecting those who would not ever participate, to 4 for those who participate often in various civic activities.
Additionally, I used several control variables listed in Table 1, along with their various sources and how I measured each one.
| Variable | Source | Details | Note |
| Youth | Afrobarometer Round 9: Question 1 (Q1) | Question was asked of respondents: How old are you? | I dichotomised the variable to distinguish between 18-35 and every other age. |
| Male | Afrobarometer Round 9: Question 100 (Q100) | Index that measures the extent to which a country is a liberal democracy | I recoded the variable as it was already dichotomised. |
| Rural | Afrobarometer Round 9: Question URBRUR | Measure based on whether respondent lived in: rural, urban, peri-urban | Questions focused on how people get their news, such as how often they listen to the radio. |
| Poverty index | Afrobarometer Round 9: Question 6a-6e | Created an index from 0 to 4 as a proxy for poverty. | I dichotomised the variable into either rural or urban. |
| Higher education | Afrobarometer Round 9: Question 94 (Q94) | Question was asked of respondents: What is your highest level of education? | |
| Employ | Afrobarometer Round 9: Question 93a (Q93A) | Question was asked of respondents: Do you have a job that pays a cash income? (If yes, ask: Is it full-time or part-time? If no, ask: Are you presently looking for a job?) | Questions focused on how people get their news, such as how often they listen to the radio. |
| Access to information | Afrobarometer Round 9: Question 74a-e | Index that measures the extent to what extent a country is a liberal democracy | Created an index from 0 to 4 as a proxy for access to information. |
| Liberal Democracy Score | Varieties of Democracy (Vdem): ID: v2x_libdem | I dichotomised the variable into two categories: Has a job or does not have a job. | |
| GDP per Capita | World Development Indicators | ||
| Population | World Development Indicators |
Table 1: List of Control Variables
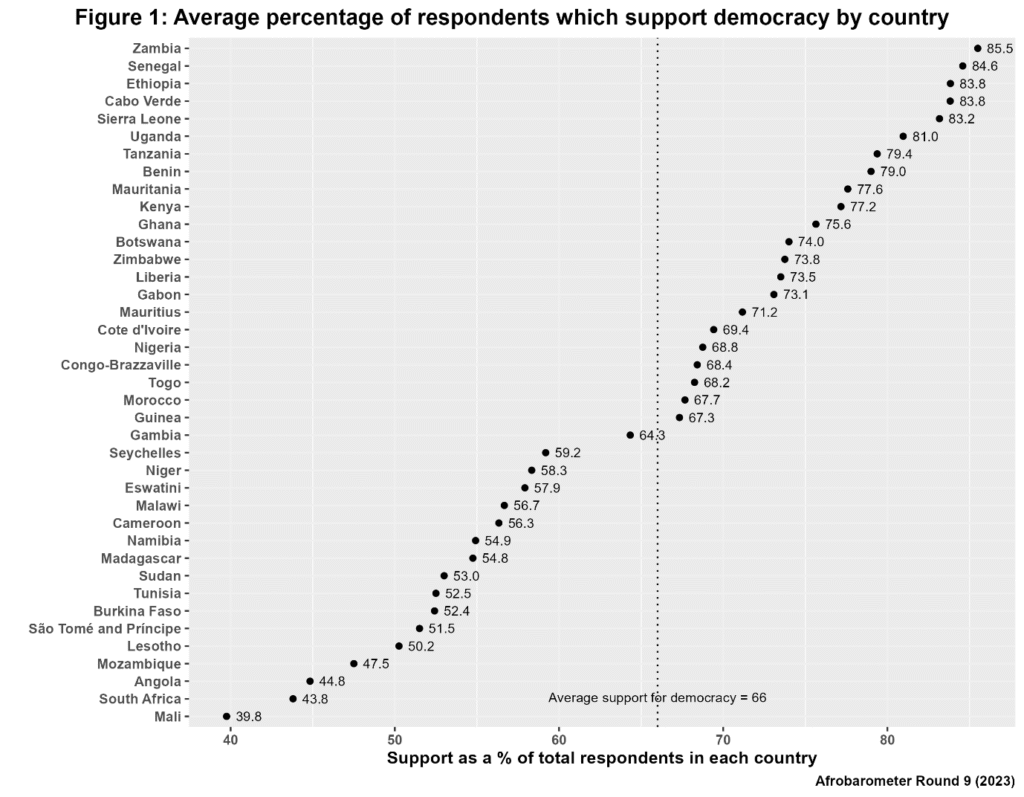
Across the 39 countries in the sample, the average support for democracy varied. As shown in Figure 1, the percentage of support ranges from 85.5% of respondents in Zambia to 39.8% of respondents in Mali. Interestingly, despite South Africa being one of the stronger democracies according to the Varieties of Democracy (VDem) liberal democracy index, citizens seem quite disenfranchised with democracy. Given South Africa’s high levels of violence, the question then becomes to what extent violence has helped shape this view? However, overall, there still seems to be a strong demand for democracy, with the average support across the sample being 66%.
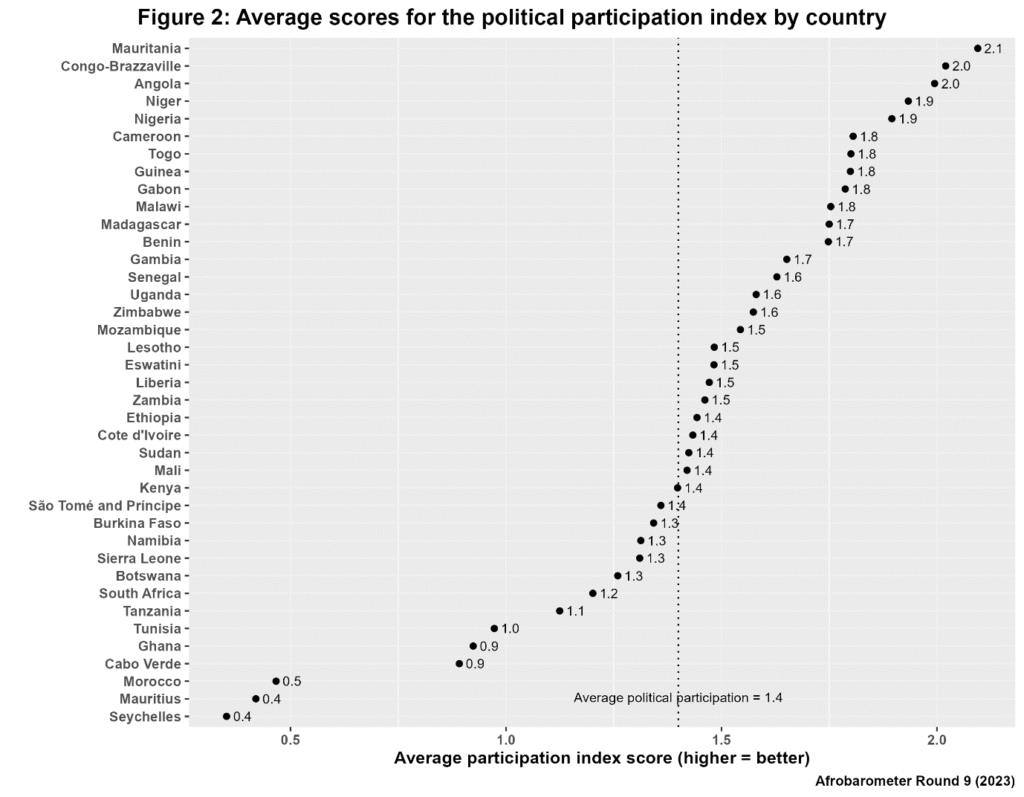
In terms of political participation across the 39 countries surveyed, as highlighted in Figure 2, the average participation score for each country is quite low. Out of a score of 4, the average across the sample is 1.4, which means that more often than not, people are not participating in civic activities. While one might expect that countries with higher democracy scores would be more active as citizens, the data from Figure 2 seems to suggest otherwise. This highlights that just because a country is not necessarily seen as a democracy, it might still have elements of democracy that exist within its political system.
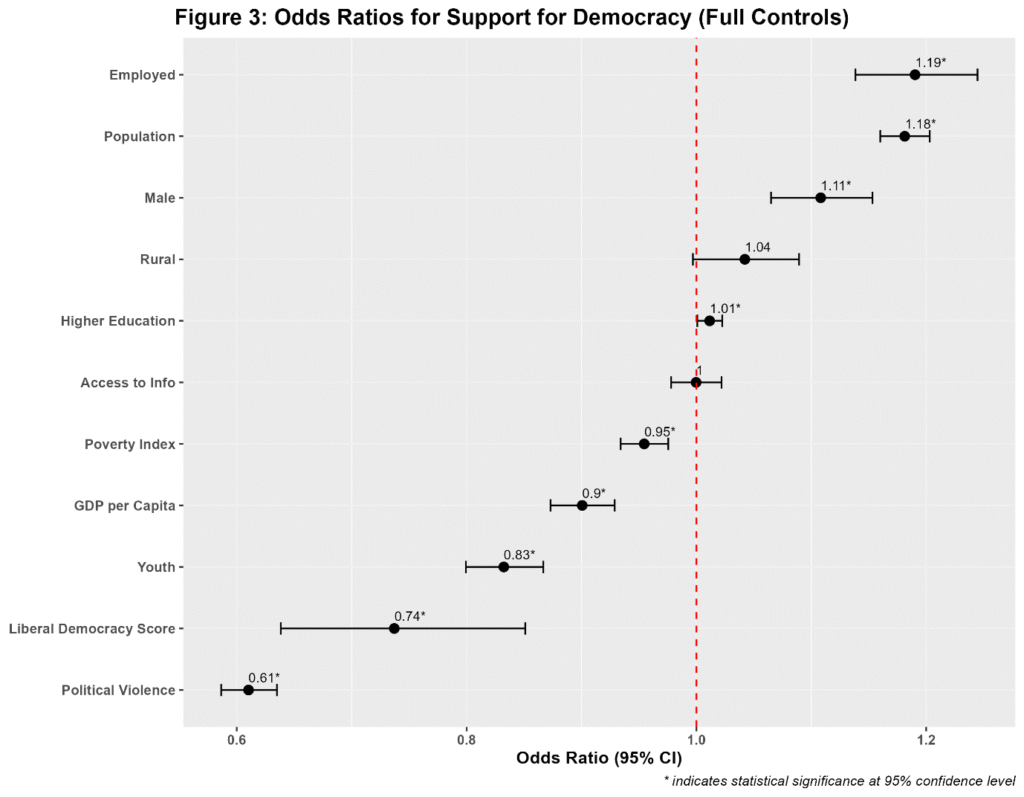
In terms of the main analysis, I used two different models for the two dependent variables. For the Support Democracy model, I used a logistic regression model and odd ratios to analyse the data. Figure 3 presents these odd ratios for the various predictor variables. The dot and corresponding number represent the odd ratio for that variable. The numbers with an asterisk are statistically significant, which is visually represented by the standard errors not including 1. This is because 1 represents there being no effect. The closer any variable gets to 1, the less effect it will have on the dependent variable. Furthermore, if the standard errors cross over 1 on either side, it means there is a likelihood of no effect between the variables. This would mean that one cannot confidently rule out the effect is just due to chance and not because the independent variable has an effect on the dependent variable.
The results show that political violence has a negative effect on one’s support for democracy. More specifically, it shows that people in countries that have higher levels of political violence are around 40% less likely to support democracy as opposed to those in countries that have lower levels. Ultimately, this supports my argument that political violence is a key driver in shaping perceptions around democracy, as there seems to be quite a strong relationship between political violence and support for democracy. Returning to the example of South Africa, it is interesting because higher levels of political violence could, in part, drive the low support for democracy. This further supports arguments made by scholars such as Jacob Lewis.
Interestingly, when looking at some of the controls included in the model, we see that young people are around 17% less likely to support democracy. In contrast, employed men tend to be more likely to support democracy.
I used an OLS regression to understand the effect of political violence on political participation. This is largely because the political participation variable is a continuous variable ranging from 0 to 4. Figure 4 presents the results of the second model. Similar to the previous figure, the numbers and asterisks represent the estimated coefficient and whether it is statistically significant. However, one key difference is that instead of 1 being the indicator for there being no effect, it is 0.
The results from Figure 4 show that political violence also negatively affects political participation. More specifically, it highlights that the greater the level of political violence, the lower the political participation index will be for that specific respondent. The effect is only around 4%, yet it is statistically significant, as one can confidently rule out that the effect is by chance. This also supports my argument that political violence negatively affects the level of political participation.

Stuart Morrison is a Data Analyst with the Governance Insights and Analytics team at GGA. His research and expertise mainly focuses on the nexus between local governance, urbanisation and elections. He has a MA in E-science (Data Science) at the University of Witwatersrand, Johannesburg, with a background in Political Science, International Relations and Development studies. His multi-disciplinary approach incorporating data science and quantitative methods allows him to provide a nuanced and data-driven approach towards his research and policy work.