Sub-Saharan governments are making easy money from selling exploration licences
For decades, scholars have searched for explanations why mineral-rich sub-Saharan Africa performs poorly on most social and economic indicators. A range of ideas have been put forward, perhaps none more convincing than the argument that the region has weak institutions, which fuels corruption and the mismanagement of finances.
In sub-Saharan Africa, the “institutional strand” of the resource curse is perhaps most pronounced in oil-rich states, where, with the exception of Nigeria, production takes place offshore or in fortified enclaves. Angola, Cameroon, Equatorial Guinea and Chad are examples of countries that “suffer from a deficit in institutions”, according to a 2005 study by Emeka Duruigbo. In these countries, rents from oil production have enriched elites, and kept corrupt dictators in power.
According to some scholars, such states have developed fairly straightforward financial transactions with regard to oil. Oil companies often operate in enclaves, forge few links with the subsistence sector and are only required to dialogue with ruling elites. In weak states, oil revenues represent “intoxicating wealth” for ruling governments, as Mazen Labben put it in a 2012 study. Oil is appealing because it offers “effortless” ways to obtain money.
Resource-rich countries in sub-Saharan Africa perform only marginally better on most development indicators than their oil-producing counterparts. Meanwhile, they have a fixation on capital-intensive, highly mechanised mineral extraction – that is, a large-scale mining bias. Why do government officials in such countries promote large-scale operations that may take several decades to reach their operational phase, when they might no longer be in office?
This may have to do with the unique life cycle of mines – a phenomenon that is seldom acknowledged in the literature on Africa’s “resource curse”.
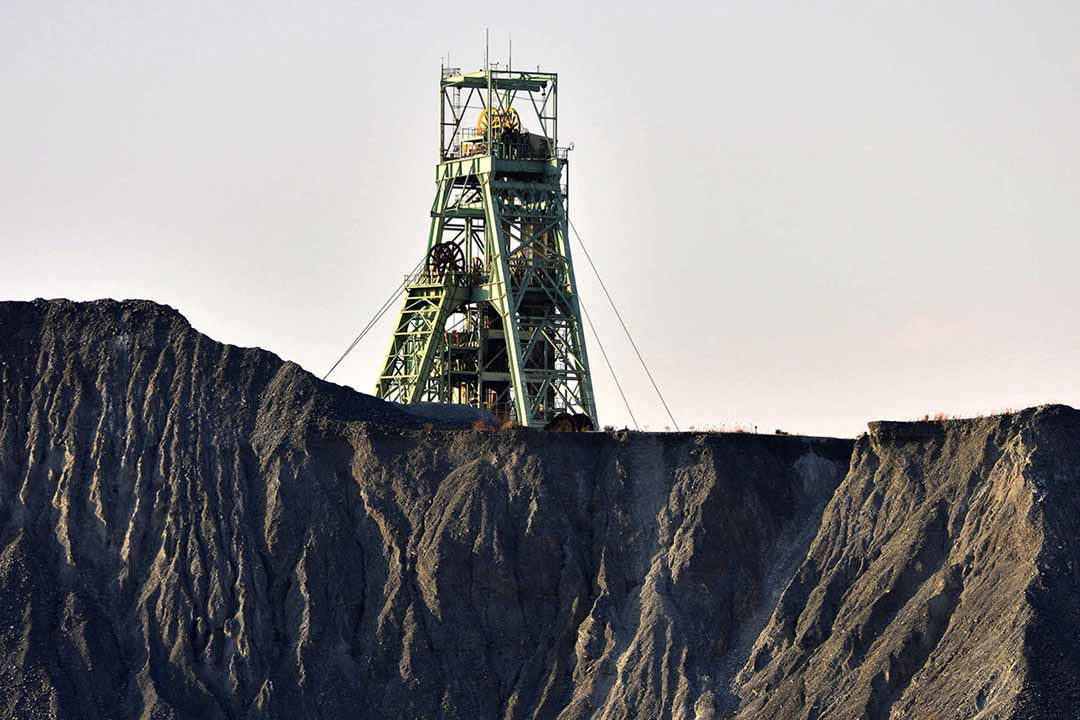
Every prospective mine must complete an extended period of reconnaissance and/or exploration, during which the size, location and value of its mineral reserves are determined. However, the permit process for reconnaissance and prospecting offers host governments an opportunity to extract revenue from companies. And the period during which these activities are licensed aligns perfectly with the mindset of rent-seeking officials.
Though they are nowhere near as large as the rents received by the region’s petro states, the revenues captured from mineral exploration companies in sub-Saharan Africa are sizable. If managed properly, they could contribute significantly to funding lasting development in host countries.
No single explanation accounts for the disappointing economic performance of the region’s resource-rich economies. What is clear is that in particular settings, certain factors apply more so than others.
In the case of mineral-rich economies, the evidence points to a combination of weak institutions, revenue mismanagement, the push to forge company-friendly deals, a lack of transparency (so that the public cannot scrutinise, influence or obtain information about such deals) and the absence of links with the surrounding economy. The list of countries seriously affected in this way includes Ghana, Tanzania and Zambia.
As Table 1 illustrates, sub-Saharan Africa has a host of mining-dependent countries – all of them relatively democratic, with the possible exception of the Democratic Republic of Congo (DRC), Mali and Burkina Faso. Like the region’s petro states, all rank at the bottom third of the Human Development Index – trapped as they are in a vicious cycle of mineral dependency that their governments have been complicit in initiating and preserving. This dependency exposes these mineral-producing countries to the mercy of volatile global commodity prices.
Table 1: Profiles of selected mineral-dependent countries in sub-Saharan Africa
| Country | Dependency on ores, metals, precious stones and non-monetary gold, 2014-2015 (%) | Main mineral commodit(ies) produced | Freedom Status | Human Development Index Score (* Denotes ‘Low Human Development’), ranking out of 188 |
| Botswana | 91 | Diamonds | Free | 108 |
| *Burkina Faso | 69 | Gold | Partly Free | |
| *Democratic Republic of Congo | 84 | Diamonds, coltan, cobalt, copper | Not Free | 176 |
| Ghana | 36 | Gold | Free | 139 |
| *Guinea | 63 | Bauxite, diamonds, gold | Partly Free | 183 |
| *Lesotho | 72 | Diamonds | Partly Free | 160 |
| *Liberia | 55 | Diamonds | Partly Free | 177 |
| *Mali | 72 | Gold | Partly Free | 175 |
| *Niger | 42 | Uranium | Partly Free | 187 |
| *Sierra Leone | 86 | Diamonds, gold | Partly Free | 179 |
| *Tanzania | 42 | Gold, coloured gemstones | Partly free | 151 |
| Zambia | 86 | Copper, coloured gemstones | Partly Free | 139 |
* Denotes ‘Low Human Development’
Sources: Freedom House, 2017; UNCTAD, 2016; UNDP, 2016
The region’s large-scale mining bias is failing to facilitate development and sustainable growth. Two factors are often cited as major reasons for this. The first is the view that some countries allow large-scale mines to operate as enclaves, which explains why they have few links with the surrounding economy. Extensive analysis has shown that this problem exists in Zambia, the DRC and Ghana. Some scholars have challenged the enclave thesis. Yet the architects of the Africa Mining Vision 2008 have called for a roadmap “formulated by African nations themselves that puts the continent’s long-term and broad objectives at the heart of all policy making concerned with mineral extraction”. Such a roadmap would implement local-content policies and ensure that mining companies forge links with indigenous goods and service providers. Yet this can be seen as an admission that the region’s large-scale mineral extraction has developed in this way. The second factor concerns royalty regimes, which have been singled out as contributing to the region’s failure to facilitate development. One common view is that the royalty regimes negotiated by host governments are not in the best interest of their populations: in exchange for favourable operating conditions, multinational mining companies turn over a small share of the revenue they earn in the form of royalties and taxes.
A 2011 report published by the African Development Bank took this view. It called on sub-Saharan governments to comprehensively review their mineral royalty regimes in an effort to ensure that countries receive a greater share of mine revenue.
Until 2007, for instance, Zambia’s royalty rate was 0.6%. In April 2008, the government introduced a variable income tax of 15% (on net profits above 8%); a windfall tax (25, 50 and 75% rates above copper price thresholds); a 15% export levy on concentrate export; a 15% withholding tax on services; and a 25% capital allowance. In addition, the royalty rate for new mine licence holders was raised to 3%. No operator was exempt from paying these taxes. Another example is Ghana’s Minerals and Mining Amendment Act 794 of 2010, which increased royalty payments on mine profits from 3% to 5%, according to a 2010 PwC report.
Another view focuses on the distribution of mine revenue, arguing that host governments are failing to spend royalties and taxes responsibly – in short, that they are “intoxicated” by this wealth. Zambia exported $5.26 billion in refined copper in 2016, according to a 2017 Observatory for Economic Complexity (OEC) report. Yet an estimated 64% of the population, and 80% of people living in rural areas, live below the poverty line, according to 2017 figures from UNICEF.
In both Mali and Tanzania, mine royalties are not redistributed, which could explain why mine-affected communities in both countries are so impoverished. In Tanzania, communities affected by mining are paid a paltry local-government levy of $200,000 per year. It is unclear if they receive this compensation. “Revenues are not earmarked, and so there is little point in tracking how much of the gold mining taxes and royalties make it back to the districts,” observes a 2017 World Bank report.
Similarly, Ghana exported $4.43 billion in gold in 2016, according to a 2017 OEC report. Meanwhile, observers have often commented on the appalling conditions of the country’s major mining towns, including Obuasi, Tarkwa and Kenyasi. The government has repeatedly claimed that this is due to the absence of a policy mechanism to manage mining revenue earmarked for development. In 2014, the country passed a Mineral Development Fund (MDF) Bill that will govern the country’s Mineral Development Fund, which receives 20% of mine revenues garnered by the Ghana Revenue Authority.
The problem in Ghana, however, is that the district assemblies – the local arms of government – and traditional authorities mismanage the money they receive as percentages of mine royalties. The Bank of Ghana flagged this problem over a decade ago. But, as recent government documents reveal, mere hundreds of thousands of dollars are involved. Even if managed properly, these meagre sums cannot have a lasting impact on development.
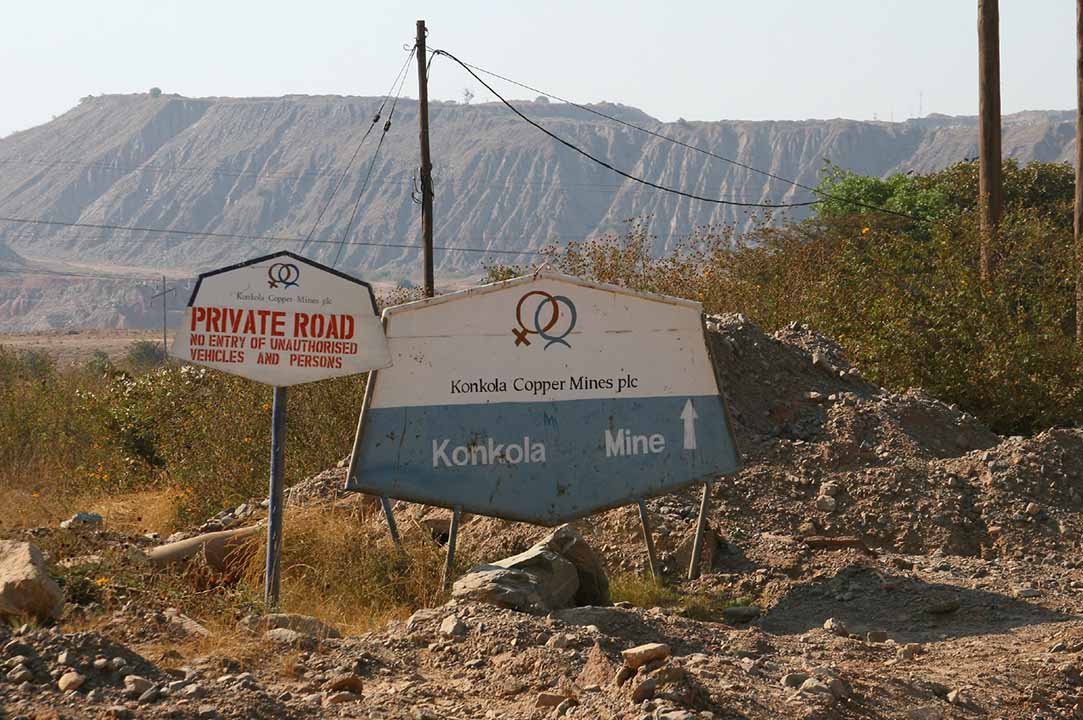
In the DRC, meanwhile, the problem is a case of blatant embezzlement by policymakers. The DRC exported $5.26 billion in minerals in 2016. Yet between 2013 and 2015, some $1.3 billion in mine revenue failed to reach the treasury, according to a 2017 Global Witness report.
A much-overlooked aspect of this equation, however, is the protracted period of mineral exploration that takes place before production. As already remarked, some scholars argue that the royalties on mine profits and taxes associated with production stimulate “sloth-like” behaviour. However, it may be the case that the interests of host governments in mining are galvanised and become entrenched during the exploration phase.
As already noted, in most cases, mining operations involve a lengthy exploration phase, when economic mineral deposits are identified and evaluated and permits are issued to companies, mostly on a short-term basis. This presents opportunities for host governments to extract licensing fees and additional taxes. The available data show that the revenue generated during this phase of mine development can be significant. It is certainly sufficient to entice host governments to commit to medium-to-long-term plans for large-scale extraction.
The exploration budget on the continent has declined steadily in recent years due to a mix of factors, including intermittent power supplies, a lack of infrastructure, the rise of illegal mining and the proliferation of civil violence. Yet the amount invested is still considerable. In 2014, it was $1.7 billion, although it had declined to $0.9 billion by 2016. The top 10 countries in sub-Saharan Africa with the greatest exploration-site activity are South Africa, Tanzania, Burkina Faso, Ghana, Botswana, Namibia, Mali, Mozambique, Côte d’Ivoire and the DRC – with the latter being the region’s leading mining-investment destination.
In 2016, nearly half (47%) of all mining activities were considered “early stage discoveries” – which reflects the strong interest in mineral exploration by the region’s governments. To ensure steady investment, countries such as Burkina Faso and Guinea are now auctioning unused permits. In 2016, Burkina Faso had some 356 unused permits for gold, while Guinea had 142 for gold, bauxite, uranium and diamonds.
Chinese companies are increasingly getting interested: in 2015, more than 120 exploration projects were Chinese. The DRC, with its untapped reserves of copper and gold and lower production costs, has proved particularly appealing.
The more established mineral producers in the region have demonstrated that considerable sums of money can be obtained, relatively straightforwardly, by ring-fencing exploration. In 2014, Tanzania had 2,073 active prospecting licences, each costing $100, and requiring a $400 “preparation fee”; these were linked to a ground-rent charge of $50/km2 and issued for up to three years. A prospecting licence could be renewed twice at a cost of $200 per renewal, provided the applicant shed at least 50% of their plot and paid a slightly higher ground rent of $60/km2, according to a 2015 Extractive Industries Transparency Initiative report.
In Ghana, 594 mineral permits were active at the time of writing, but only about 40 of these were linked to production. The size of a reconnaissance licence is limited to 1,050 km for a period of one year, and the initial grant for a prospecting licence is limited to 157,5 km2 for a period of three years. These can be renewed for an additional two terms of three years each, but the holder must surrender not less than half of the original plot. As Table 2 reveals, each company pays a considerable amount of money for reconnaissance and prospecting licences.
In 2013, in one of the poorest countries on the planet, Burkina Faso collected over $400 million in mining revenue. Although it only hosts 18 operational mines, there are over 300 active prospecting licences in the country, each of which covers a maximum area of 250 km2 and is active for a maximum of three years. Between 2011 and 2013 it collected $51 million in licensing fees from mining, the majority from prospecting activities.
Table 2: List of reconnaissance and prospecting licences granted in Ghana in 2014
|
Name of Company |
Main Mineral | Size (km2) | Mineral Right |
Amount Paid, 2014 US$ |
| Alharris Company Limited | Gold | 89.45 | Reconnaissance | 5113 |
| Asaray Company Limited | Gold | 17.01 | Reconnaissance | 827.7 |
| Kopaclif Limited | Gold | 5.31 | Reconnaissance | 1550 |
| Kopaclif Limited | Gold | 2.34 | Reconnaissance | 1550 |
| Arise Mining Company Limited | Gold | 35.07 | Prospecting | 3412 |
| Angel Royal Gold Mines Limited | Gold | 44.94 | Reconnaissance | 2186 |
| Midlands Minerals Corporation | Gold and Diamonds | 5.76 | Prospecting | 12,400 |
Source: EITI, 2015b
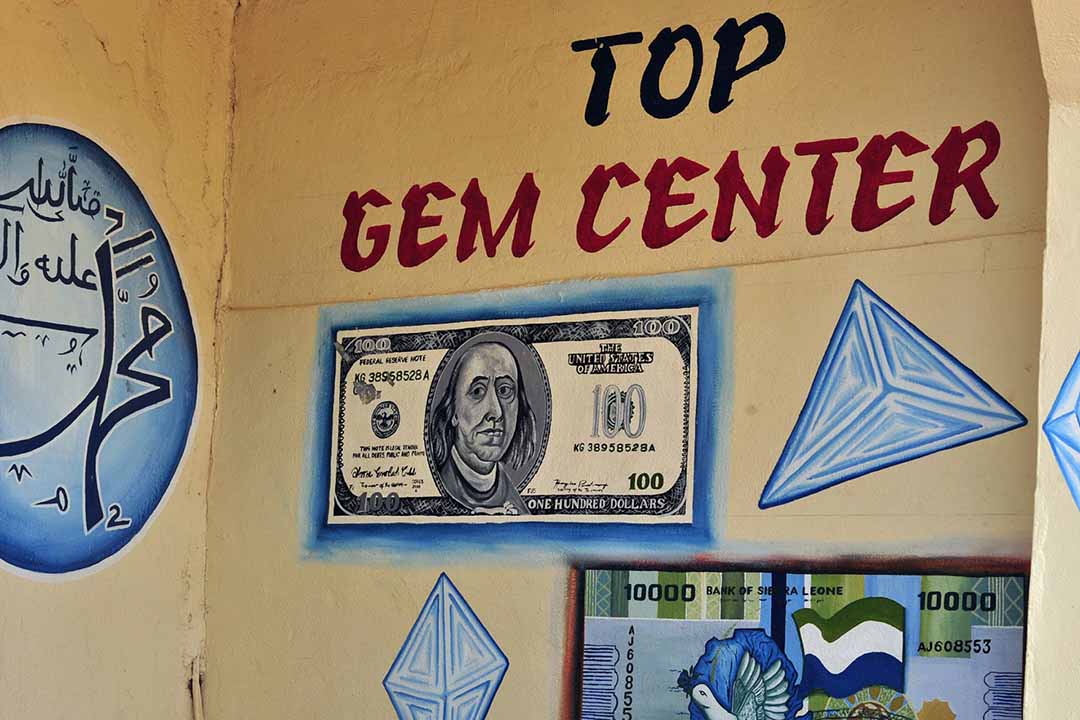
Even countries that have little chance of becoming major large-scale mine producers seem intoxicated by the bias. Sierra Leone barely has a large-scale mining industry and would be better off promoting and supporting indigenous small-scale mining, but it continues to award prospecting licences to foreign companies.
In 2014 it collected $53 million in mine revenue; some $1.93 million of this was in exploration fees, while an additional $2.5 million involved environmental impact assessments, which must be completed before a mining licence can be secured.
In neighbouring Liberia, only $23 million of the approximately $100 million that the government earned from mining in 2014 came from royalties. Other countries in the region are implementing mining-sector reforms, and are expected to follow in the footsteps of these nations.
Yes, mineral-rich sub-Saharan African countries have weak institutions. There are indications that rents and royalties from production have encouraged “sloth” and complacency. But any analysis of the resource curse of Africa’s mineral-rich landscapes must include the reality discussed here.
A protracted period of exploration presents opportunities for host governments to levy taxes and charges over the short term. This helps to explain the deeply engrained bias towards large-scale mining in sub-Saharan Africa. These rents can be obtained with minimal effort, and can be sufficient to entice host governments to pursue a path of large-scale mine development, however unsustainable it may be.
Mineral rents in Africa (% of GDP)
| 2000 | 2001 | 2002 | 2003 | 2004 | 2005 | 2006 | ||
| Algeria | 0.04 | 0.03 | 0.03 | 0.03 | 0.04 | 0.08 | 0.11 | |
| Benin | 0.00 | 0.00 | 0.00 | 0.00 | 0.00 | 0.00 | 0.00 | |
| Botswana | 1.00 | 0.00 | 0.00 | 1.09 | 2.68 | 3.28 | 7.43 | |
| Burkina Faso | 0.00 | 0.00 | 0.02 | 0.03 | 0.09 | 0.12 | 0.25 | |
| Burundi | 0.00 | 0.00 | 0.04 | 0.12 | 0.23 | 0.24 | 0.50 | |
| Cameroon | 0.00 | 0.00 | 0.01 | 0.01 | 0.03 | 0.03 | 0.07 | |
| Central African Republic | 0.00 | 0.00 | 0.00 | 0.00 | 0.00 | 0.00 | 0.01 | |
| Chad | 0.00 | 0.00 | 0.00 | 0.00 | 0.00 | 0.01 | 0.02 | |
| Côte d’Ivoire | 0.00 | 0.01 | 0.03 | 0.04 | 0.03 | 0.04 | 0.07 | |
| Democratic Republic of Congo | 0.09 | 0.18 | 0.21 | 0.47 | 1.57 | 2.35 | 6.52 | |
| Egypt | 0.02 | 0.04 | 0.04 | 0.05 | 0.06 | 0.08 | 0.08 | |
| Equatorial Guinea | 0.01 | 0.01 | 0.04 | 0.06 | 0.01 | 0.01 | 0.02 | |
| Eritrea | 0.00 | 0.00 | 0.00 | 0.00 | 0.01 | 0.01 | 0.02 | |
| Ethiopia | 0.00 | 0.00 | 0.05 | 0.12 | 0.09 | 0.13 | 0.22 | |
| Gabon | 0.00 | 0.00 | 0.00 | 0.00 | 0.01 | 0.01 | 0.03 | |
| Ghana | 0.10 | 0.13 | 0.86 | 1.80 | 2.00 | 2.28 | 2.93 | |
| Guinea | 5.55 | 5.95 | 5.07 | 4.13 | 5.12 | 10.30 | 14.32 | |
| Kenya | 0.00 | 0.00 | 0.01 | 0.02 | 0.01 | 0.01 | 0.01 | |
| Liberia | 0.00 | 0.00 | 0.01 | 0.01 | 0.06 | 0.02 | 0.01 | |
| Madagascar | 0.00 | 0.00 | 0.00 | 0.00 | 0.00 | 0.00 | 0.01 | |
| Malawi | 0.00 | 0.00 | 0.00 | 0.00 | 0.00 | 0.00 | 0.00 | |
| Mali | 0.11 | 0.23 | 2.22 | 2.73 | 2.57 | 3.21 | 7.09 | |
| Mauritania | 10.77 | 11.25 | 9.82 | 9.97 | 11.61 | 23.85 | 18.73 | |
| Morocco | 0.53 | 0.47 | 0.41 | 0.16 | 0.19 | 0.25 | 0.56 | |
| Mozambique | 0.00 | 0.00 | 0.00 | 0.00 | 0.00 | 0.01 | 0.01 | |
| Namibia | 0.19 | 0.14 | 0.30 | 0.35 | 0.46 | 0.84 | 2.33 | |
| Niger | 0.00 | 0.00 | 0.00 | 0.00 | 0.08 | 0.66 | 0.68 | |
| Nigeria | 0.00 | 0.00 | 0.00 | 0.00 | 0.00 | 0.00 | 0.00 | |
| Republic of the Congo | 0.00 | 0.00 | 0.00 | 0.00 | 0.01 | 0.01 | 0.01 | |
| Rwanda | 0.00 | 0.00 | 0.00 | 0.00 | 0.00 | 0.00 | 0.00 | |
| Senegal | 0.17 | 0.14 | 0.11 | 0.02 | 0.03 | 0.03 | 0.06 | |
| Sierra Leone | 0.00 | 0.00 | 0.00 | 0.00 | 0.01 | 0.02 | 0.77 | |
| South Africa | 0.47 | 0.49 | 0.82 | 0.90 | 0.98 | 1.37 | 2.12 | |
| Sudan | 0.00 | 0.00 | 0.03 | 0.06 | 0.06 | 0.05 | 0.07 | |
| Tanzania | 0.00 | 0.01 | 0.25 | 0.78 | 1.08 | 1.15 | 2.22 | |
| Togo | 0.48 | 0.32 | 0.27 | 0.00 | 0.00 | 0.00 | 0.00 | |
| Tunisia | 0.03 | 0.01 | 0.01 | 0.01 | 0.02 | 0.04 | 0.03 | |
| Uganda | 0.00 | 0.00 | 0.00 | 0.00 | 0.07 | 0.09 | 0.15 | |
| Zambia | 1.04 | 0.00 | 0.00 | 0.78 | 7.05 | 9.59 | 18.06 | |
| Zimbabwe | 0.51 | 0.21 | 0.46 | 1.25 | 2.53 | 2.69 | 5.05 |


