Africa’s middle class: how good are the numbers?
Until data collection and analysis used to measure income distribution improve, the continent’s statistics are unreliable
On April 20th 2011 the African Development Bank (ADB) declared that not only was Africa rising, but that statistics on income distribution revealed a sizeable middle class now comprising 34% of Africa’s population—or nearly 350m people. Earlier that year, The Economistannounced that IMF forecasts predicted that seven out of the ten fastest-growing economies in the world over the next five years would be in Africa.
The year before, Ghana’s Statistical Services revised the country’s GDP upwards by 63%. This year Nigeria’s National Bureau of Statistics made an even bigger splash when a similar exercise showed the Nigerian economy to be 89% bigger than previously thought, and had displaced South Africa as the continent’s largest economy. Later this year, Kenya is also expected to make a sudden statistical leap after it broadens its survey of economic activity.
These statistical earthquakes, while good news, have shattered trust in Africa’s numbers. Shanta Devarajan, chief economist of the World Bank’s Africa region, called it “Africa’s statistical tragedy” when he reflected on the quality and availability of quantitative evidence in the aftermath of Ghana’s GDP revision.
In retrospect it may seem puzzling that bewilderment has greeted what has essentially been good news—African economies and its middle class are bigger than we thought. But for too long, we have neglected the accuracy of African economic statistics. We are only now waking up to the size of the knowledge gap because suddenly the numbers on African economies matter.
Investors and social scientists rely on accurate measurements. If 350m middle class Africans really existed, investors would consider Africa a potentially lucrative market for making deals in sectors such as real estate, retail, wholesale and communications. These huge numbers would force social science scholars to redefine and jettison hackneyed development phrases such as “subsistence”, “informal economies”, “food security” and “poverty eradication”.
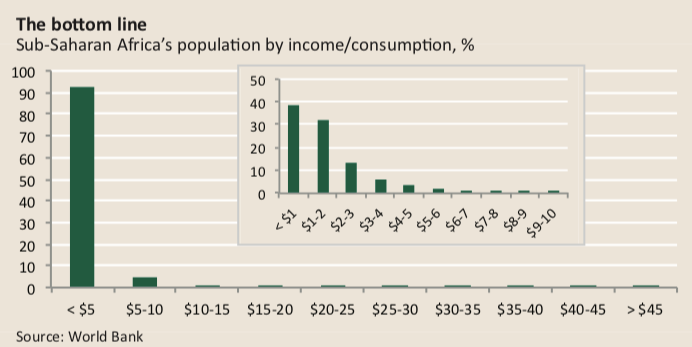
However, the ADB’s 2011 report conceded that 60% of Africa’s middle class, approximately 180m, people were barely out of poverty. This startling admission was based on its expansive definition of the middle class: individuals who spend between $2 to $20 daily.
For political scientists the middle class is the backbone of a democratic society. In Marxist theory the rise of the bourgeoisie permits progressive modernisation and industrialisation. For investment banks, multinational corporations, real estate developers and traders, the middle class is defined by purchasing power and signifies a potentially untapped market.
For this reason, a more accurate middle-class definition requires a higher purchasing-power bracket that shows that households are living beyond subsistence and that its members are also high school and university graduates.
Researchers affiliated with international organisations and investment banks have also tried to count Africa’s middle class. Some surveys, such as accounting firm Ernst & Young’s 2012 “Africa by numbers” report, dance around the actual size, and prefer instead to refer to “a growing middle class”. Here Similarly, “The Rise of the African Consumer”, a 2012 report from McKinsey, a consulting and research company, stays out of the numbers game altogether and never mentions the middle class. Standard Bank released a report in June assessing 11 sub-Saharan economies, or half this region’s total GDP, to measure the size of the continent’s middle class.
Based on these reports, the size of Africa’s middle class stretches from as little as 15.7m households as estimated by McKinsey to the 350m the ADB assessed in 2010. Completely different monetary definitions of the middle class drive these differences. The ADB’s bottom threshold of $2 per day is much lower than the $10 per day used by the OECD, a Paris-based intergovernmental think-tank, Standard Bank’s $23 or McKinsey’s $55. In addition, the OECD and ADB report their statistics in total number of people, while McKinsey and Standard Bank report on households without specifying their size.
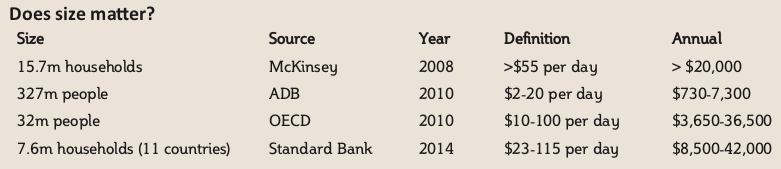
It may appear puzzling that Standard Bank defines the middle class as households that spend between $8,500 and $42,000, while McKinsey’s 2010 “Lions on the move” report defines this group as households that spend above $20,000 a year.This can be reconciled. McKinsey includes all households above $20,000 in disposable income. This means that they also count very rich households, which explains why their estimate is higher. In its other report, “The Rise of the African Consumer”, McKinsey contends that 40% of spending power growth will come from households that earn above $20,000 annually. They note that “this group currently accounts for just 1-2% of total households” but that this income cluster is “growing faster than the overall average, both in numbers and in average income”.
So what we are we left with? We went from a middle class that represents 34% of Africa’s population to one that represents 1-2%. But the 1- 2% are not middle class; they are very rich households indeed. Moreover, it is these households in the top 1-2% that have the fastest-growing incomes. Ultimately, what we are seeing is not a pyramid bulging in the middle as in the picture provided by the ADB. The numbers from McKinsey and Standard Bank describe a society where the top spenders are getting richer. This may be good news for some banks and investors, but it does not carry the same connotations for social scientists.
None of the above, however, explains how these numbers were calculated or whether they are trustworthy. It is highly likely that many of the GDP growth numbers exaggerate actual increases in productivity and improvements in living standards.
Both Ghana’s and Nigeria’s GDP nearly doubledfollowing the introduction of new benchmark years for estimating GDP in 2010 and 2014. How confident can one be about a 7% growth rate in a country like Nigeria when 89% of the economy was missing in the official baseline?
Some commentators proclaim that Africa is growing faster than its outdated measurements suggest. Indeed, some countries’ economies are larger than those shown by these old numbers. But that does not mean that recent growth has been faster too. The opposite is likely.
An outdated baseline means that “new” growth is more than likely “previously unrecorded” growth. When the base is too small, the proportion of economic growth will be overstated. Moreover, when statisticians and politicians know that their numbers are minimising total GDP, it is tempting to add a bit each year to pre-empt a large upwards revision when the GDP numbers are ultimately corrected.
GDP growth estimates are also misleading because only parts of the economy are recorded. Changes in exports and foreign direct investment are quantifiable and easily measured, while other important sectors that may be moving less quickly, such as food production, often remain unobserved.
In developed countries, like Norway, income, production and expenditure of persons and companies are reasonably well recorded and available through administrative records. The government routinely collects this information as part of its day-to-day operations.
In poorer countries, few companies and even fewer individuals, households and farms record or report income, production and expenditures. To get a measure of how income is distributed in a country and how many people have less than $2 a day requires drawing a graph with income on the X-axis and population on the Y-axis. On such a graph you can account for the share of households that earn below $2, $3 or $4 a day, and calculate the income ratio of the top 1% and bottom 10%.
Drawing this graph presumes this information is available. In practice, however, these numbers are mostly non-existent because data collection is expensive and time consuming. The most common audit, the Living Standards Measurement Study, is used by the World Bank to obtain poverty statistics. It requires each household to spend a day filling out a long questionnaire. A typical survey with a sample of about 2,000 households costs a few million dollars. From data collection to dissemination takes another two years.
According to a May 2013 report by the Brookings Institution, a Washington, DC-based think-tank, six of sub-Saharan Africa’s 49 countries have never conducted a household survey and only 28 countries have done one in the past seven years. Surveys measuring social indicators such as health and demographics also have similar gaps. Moreover, only about 60 countries in the world have vital registrations systems required to monitor trends in social indicators, and none of these are in Africa, according to an article by Amanda Glassman, a senior fellow at the Washington, DC-based think-tank Center for Global Development. Any statement about the size and direction of poverty and income in the world, particularly in Africa, relies on many assumptions and extrapolations, a practice that can lead to gross inaccuracies.
Reports on the size of Africa’s middle class highlight these presumptions and (mis)calculations. The Standard Bank report, which provides a conservative estimate of the size of the middle class, is based on a sample of 11 countries. The problem is that data availability is not random – it is biased because we know more about the richer economies, such as Nigeria and Ghana, than we know about poorer, more problematic countries such as the Democratic Republic of Congo, Somalia or Côte d’Ivoire. Another complication is that we do not know how Standard Bank determined middle-class growth rates for years that lack official information on income distribution, nor how it dealt with the very well-known discrepancies and incoherencies in Nigeria’s household surveys.
It is undeniable that more goods are leaving and entering the African continent today than 15 years ago. But does the increase in the volume of transactions result in a sustained lift in living standards? Some might argue that a positive African narrative and the power of self-fulfilling prophecies might make the vision of a huge middle class in Africa come true.
A fact-based outlook, however, is the best path. Does Africa’s population really have more spending power? Are fewer Africans hungry?
The evidence on income distribution does not provide accurate answers. Everyone wants to know if the continent is better off, but proclaiming that it is without solid proof may backfire—particular if poverty reduction and income distribution are slower and more unequal than what has been publicised. Impartial and inaccurate numbers too often lead to poor policy decisions.
[author] [author_image timthumb=’on’][/author_image] [author_info]Morten Jerven is an economic historian and the author of “Poor Numbers: How We Are Misled by African Development Statistics and What to Do about It”. He has published widely on African economic development. [/author_info] [/author]